A treatment budget can make a research percentage seem unusually practical. A reader might hope to turn a symptom figure into a prediction about interruptions, appointments, or unused payments. Before doing that, ask what the number actually measures. An event, a person, a period of observation, and a charge are different units. Moving between them requires evidence about their connections; a familiar drug name does not provide those connections.
This article develops a way to read the accompanying semaglutide figure before applying it to a different decision. Start with its caption and data table, then work through the denominator, comparison, and observation rule. The discussion that follows is editorial interpretation of those measurement choices. Its aim is to make the scientific question more precise, so a separate financial question does not quietly replace it. A useful finding can remain useful even when it cannot supply the particular forecast a reader wants.
Wide tables can scroll horizontally. Keyboard users can focus a table region and use the arrow keys to move across it.
Reading the evidence
- Define the unit
- Identify what receives a count before interpreting the size of a percentage.
Sources: Wharton et al.
- Keep the frame
- A denominator describes the group to which a proportion belongs.
Sources: Wharton et al.
- Name the clock
- An observation window needs a starting point and an inclusion rule.
Sources: Wharton et al.
- Match the question
- A comparison answers the question defined by its participants and alternatives.
Sources: Wharton et al.
- Trace the inference
- A financial conclusion requires evidence connecting clinical measurement with payment.
Sources: Wharton et al.
Later nausea reports
STEP 4, weeks 20–68; weekly subcutaneous semaglutide 2.4 mg continued versus placebo switch.
Adults without diabetes, overweight/obesity; run-in tolerators.
New-onset nausea. On treatment: dose within 49 days.
Sources: Wharton et al.
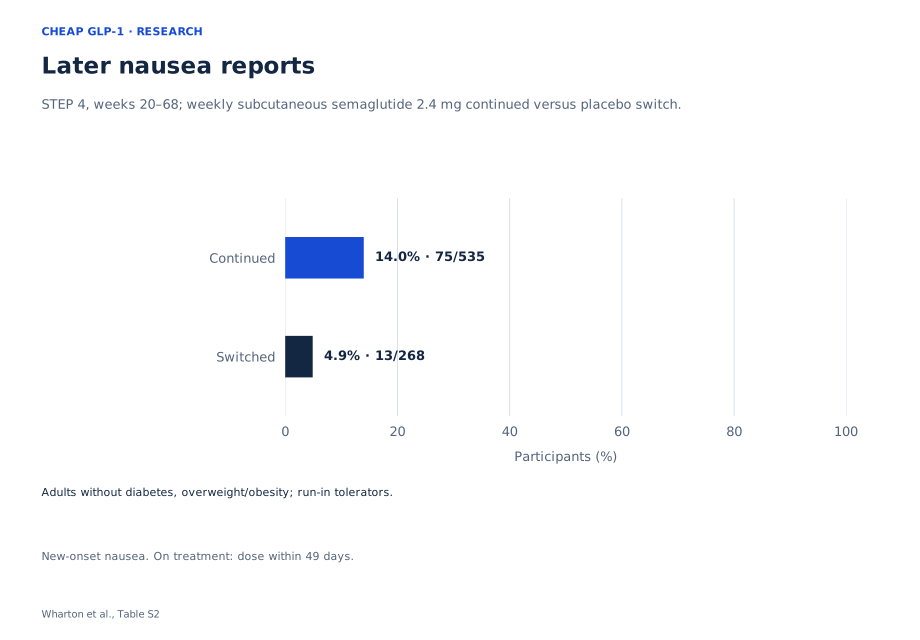
| Arm | n/N | Percent |
|---|---|---|
| Continued | 75/535 | 14.0% |
| Switched | 13/268 | 4.9% |
Read the measurement before the bars
Wharton’s post hoc analysis examined trials funded by Novo Nordisk; three contributing authors were company employees and shareholders.
That provenance belongs beside the evidence. It invites scrutiny of the question, methods, and interpretation without supplying a shortcut for accepting or dismissing a result. A methodological reading asks whether the stated measure supports the sentence being written about it. Who paid for research and what a particular table measures are related questions about credibility, but they are not interchangeable answers.
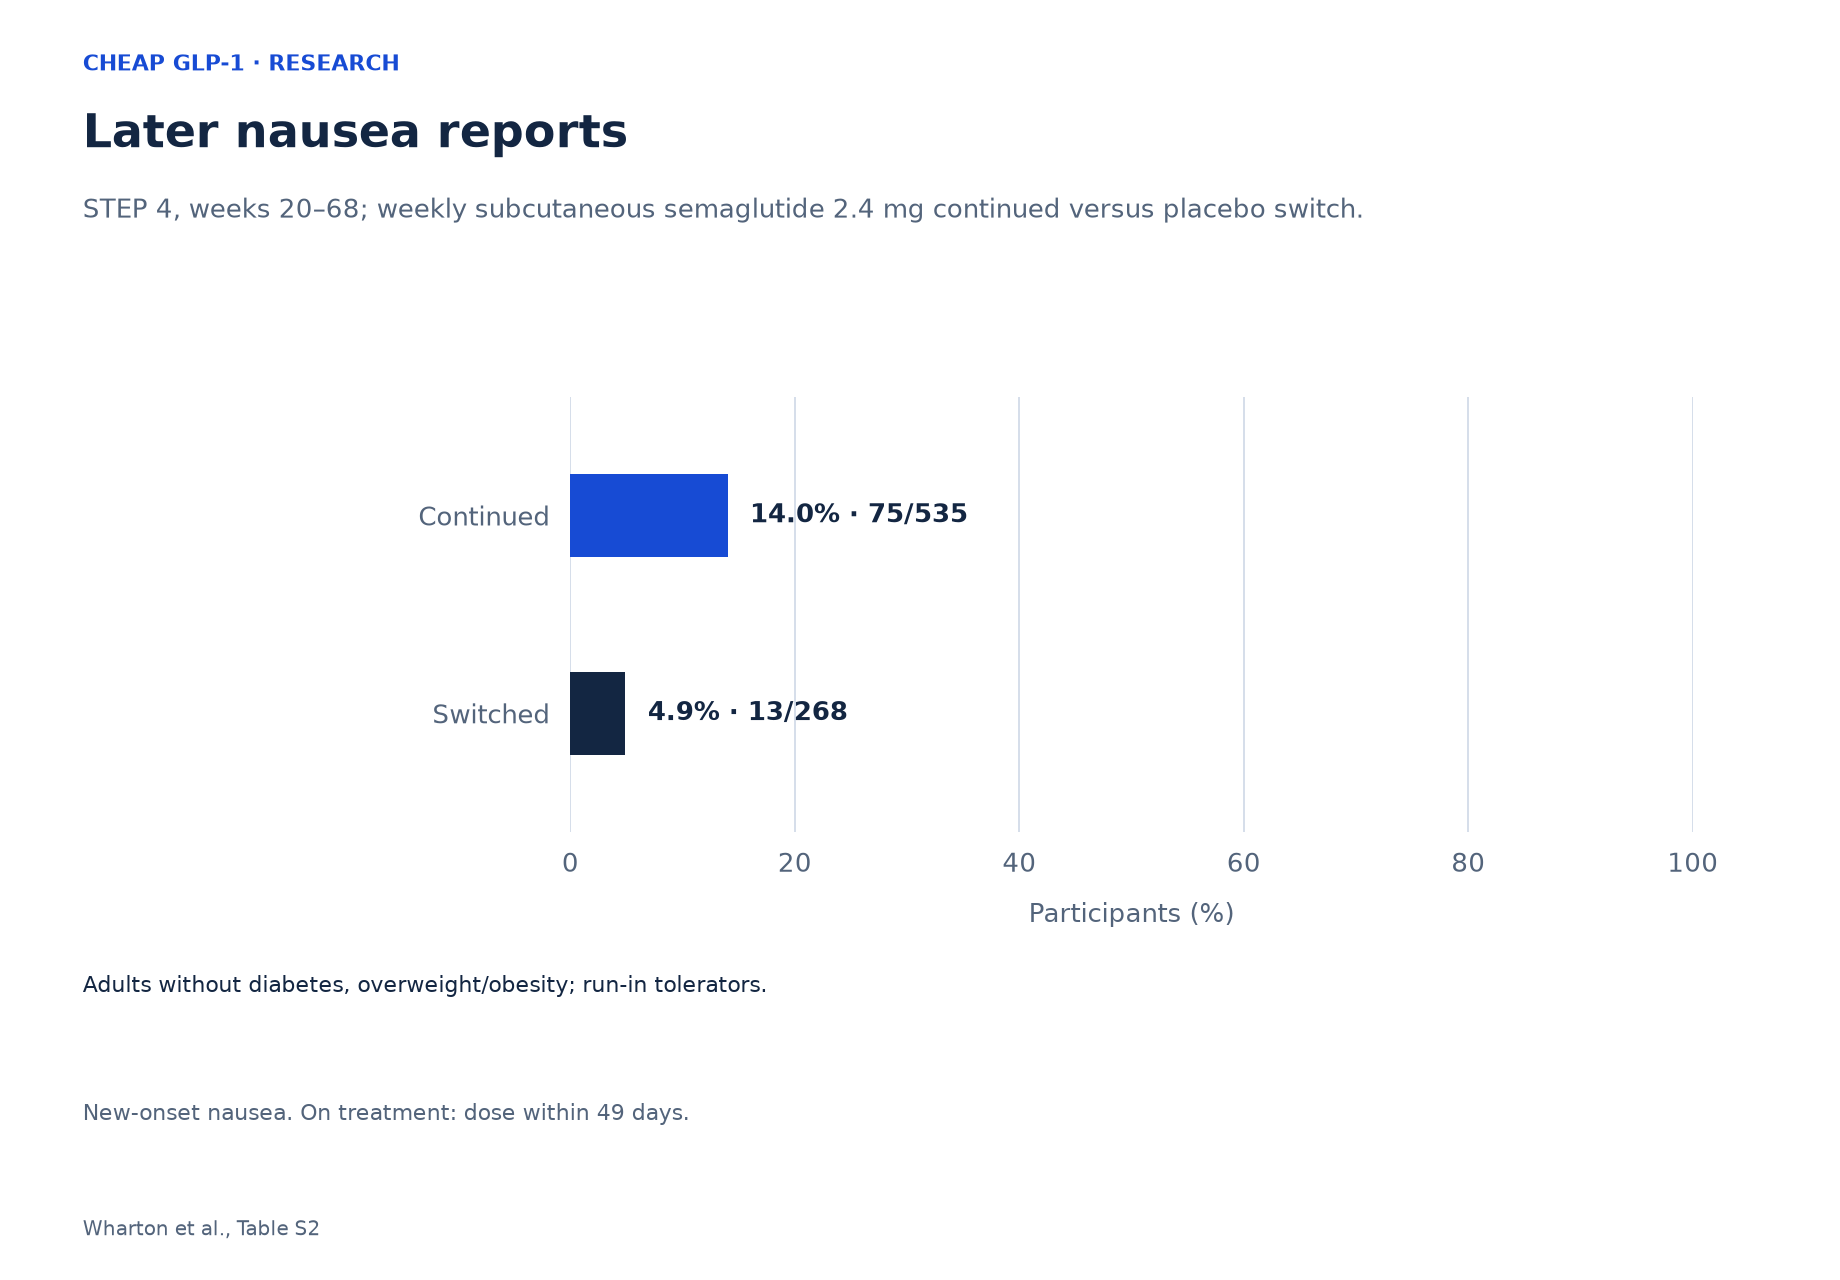
For this figure, read the caption before comparing bar lengths. The horizontal axis expresses a proportion; the vertical labels identify the arms being displayed. The accompanying fractions make the counting unit inspectable. Treat each qualifier in the caption as part of the measurement rather than as small print that can be discarded when the result is summarized.
A useful reading exercise is to finish this sentence: among the people included under this rule, during this observation window, this was the recorded outcome. Then write the question you actually want answered underneath it. If the second sentence introduces a different population, period, or outcome, identify that change explicitly. The extra words are where a new inference begins.
Sources: Wharton et al.
The denominator sets the scope of the fraction
The denominator is more than a device for making groups comparable in size. It defines whose observations can contribute to the result. Changing that membership changes the question, even if the outcome label remains identical. A proportion should therefore travel with its eligibility and observation definitions wherever it appears.
Read the displayed numerator as belonging to its own denominator. Comparing raw numerators alone would ignore the size of the groups from which they came. Comparing percentages is more informative for that particular purpose, but it does not erase differences in how membership was established. The fraction is an organized description, not permission to substitute any other group of interest.
This distinction becomes useful when a reader asks about people considering treatment, people already receiving it, or people meeting another condition. Those phrases define potentially different target groups. A scientific explanation should name the intended target before considering whether the evidence transports to it. Our guide to calculating total GLP-1 cost addresses the separate task of organizing charges; a cost worksheet cannot redefine a study denominator.
The table below is an editorial teaching tool. Its rows show how to separate a measurement question from a convenient shortcut; they are not additional trial findings.
| Question | Evidence to inspect | Unsupported shortcut |
|---|---|---|
| Who is represented? | Eligibility and observation rules | Treat every interested reader as an included participant |
| What was counted? | The outcome definition and counting unit | Treat a person count as an episode count |
| When was it counted? | The window and its starting point | Treat a whole-period result as a monthly forecast |
Sources: Wharton et al.
Allocation and applicability require separate judgments
Random allocation and broad applicability solve different problems. Allocation is a way of organizing a comparison among eligible participants. Applicability asks whether the comparison can inform a different population or setting. A reader should not use the existence of one as proof of the other, or the limits of one as a reason to ignore the other.
The selection note attached to a figure is therefore scientifically important. Think of it as a condition placed around the question. A conclusion within that condition may be coherent while a broader conclusion requires more evidence. Calling a group selected does not itself show that the comparison inside the group is defective. It identifies a boundary that a later interpretation must respect.
An applicability assessment can be written as a list of possible mismatches: population, treatment definition, observation process, and outcome. Each mismatch creates a question to investigate. Counting how many labels appear similar is not a validated score, and this article does not create one.
For documentary comparisons of product categories, see compounded versus FDA-approved medicines. Use that reading to sharpen the identity question. A shared ingredient name alone does not establish that a different product or service inherits the clinical result in a study figure.
Sources: Wharton et al.
Give each observation its own starting point
An interval needs an origin. The beginning of an entire process, the beginning of a comparison, and the beginning of a recorded experience can be different events. Without naming the origin, a statement about what happened during treatment is too vague to tell the reader which question was measured.
Read the window printed above the chart literally. Its boundaries determine which experiences belong inside that summary. Moving the left boundary earlier is not a harmless change of wording: it asks for additional observations. Moving the right boundary later does the same. A figure cannot answer an expanded question merely because its existing interval looks long.
An observation rule also differs from a calendar label. The calendar describes when something could happen; the rule determines which observations are included. To interpret a result, ask both questions. This prevents the phrase during follow-up from becoming a substitute for a clear definition of the evidence being used.
There is a useful documentary parallel in introductory versus ongoing prices: the starting point of a payment period matters to the question being asked. That is an analogy about defining time. It does not connect a payment schedule to the timing of symptoms or imply that research and billing clocks coincide.
Sources: Wharton et al.
A yes-or-no record cannot preserve a whole history
A binary record reduces a history to a threshold: did the defined event occur? That reduction can be useful, because it makes a particular question countable. But it removes detail. Knowing that the threshold was crossed does not by itself reveal recurrence, duration, sequence, or the practical consequences of the experience.
Consider a deliberately fictional equipment example. Two monitors each record whether a machine ever displayed an alert during an inspection period. One machine displays a brief alert; the other displays repeated alerts. Both receive the same yes entry. This illustration concerns the information lost by a counting rule, not the behavior of medicines or patients.
The implication for reading a clinical figure is methodological. Choose the measure that matches the question. If the question concerns recurrence, a person-level indicator is incomplete. If it concerns duration, an event log needs start and end information. If it concerns consequences, those consequences need their own definitions and observations.
None of this makes a simpler measure unhelpful. It makes the measure specific. A common interpretive mistake is to ask a compact summary to perform the work of several different datasets. More decimal places would not restore information that the chosen counting unit never retained.
Sources: Wharton et al.
Do not manufacture a monthly probability
Dividing a proportion by the number of months may appear to create a manageable planning figure. The arithmetic is easy; the interpretation is the difficult part. A whole-period summary does not tell us how observations were distributed through time or how membership in the group at risk changed. Equal slices on a calendar do not establish equal chances in those slices.
A monthly probability would need a clearly specified question. Does it concern a first occurrence among people who have not yet had one, any occurrence among everyone still observed, or repeated experiences? These definitions can require different numerators and denominators. Choosing a monthly label without choosing the underlying event process leaves the proposed number undefined.
Nor can a bar reveal that event timing was uniform. Uniform timing would be an added assumption, not a feature recovered simply by dividing. If an analyst uses an assumption to build a model, the model and its justification must be visible. This article builds no such model.
The practical scientific test is to identify the missing information before calculating. Ask for timing, membership, and a suitable event definition. When those elements are unavailable, retaining the original observation window is more accurate than presenting an invented monthly forecast with a precise-looking decimal.
Sources: Wharton et al.
Preserve the comparison when interpreting a difference
Every comparison defines alternatives. Before drawing a conclusion from the space between bars, read the alternatives exactly as labeled and consider what would change if they were replaced. A comparison involving a different starting position, sequence, or treatment definition would answer a different question, even if one name remained familiar.
This is why the comparator deserves as much attention as the treatment label. The relevant interpretation concerns the contrast that was organized, not an unspecified contrast against doing something else. A useful question is: what alternative does this evidence actually help distinguish? Write that alternative in words before discussing a difference.
A comparison also does not explain every pathway through which a difference could arise. Description, attribution under a study design, and a detailed biological mechanism are different levels of explanation. Moving from one level to another requires supporting evidence; a visual gap does not supply all three.
Our companion tirzepatide evidence analysis offers another exercise in defining the question behind an event measure. Read each analysis within its own design. Putting two figures on neighboring pages would not create a direct comparison between medicines, and it would not rank the services through which a reader might seek care.
Sources: Wharton et al.
Separate numerical precision from unanswered questions
A reported percentage can look precise while leaving an important question unresolved. Precision of display refers to how a number is written. Uncertainty concerns what conclusions the evidence supports. The two should not be confused: retaining a decimal place does not establish a personal prognosis or describe every plausible value for an underlying quantity.
The counts in a data table let a reader inspect the displayed proportions. They do not automatically provide every analysis required for a new claim. A confidence interval, significance test, or adjusted comparison needs an appropriate method and assumptions. None is calculated here. The absence of an added calculation should not be recast as evidence either for or against a particular statistical conclusion.
There is also uncertainty about transport: whether a finding can inform another setting. That question is distinct from sampling uncertainty within a defined analysis. A narrow numerical interval, if available elsewhere, would not by itself answer a mismatch in population or measurement.
A disciplined interpretation can name these uncertainties separately. State what the displayed measure describes, identify the additional inference being considered, and specify the evidence that inference needs. This approach leaves room for useful conclusions without pretending that every unresolved question has the same source or the same remedy.
Sources: Wharton et al.
Keep the clinical record separate from the payment record
The editorial application to budgeting is a chain of questions, not a price calculation. An observed experience, a clinical assessment, a decision about care, and a financial consequence are separate variables. Evidence connecting adjacent steps is needed before one can stand in for another. A symptom count cannot silently become a count of paid visits or canceled purchases.
The teaching table below shows the missing connections. It is not a claim that any listed consequence occurred in the study. Its purpose is to locate the evidence needed for a financial interpretation and make unsupported substitutions easier to recognize.
For the contractual part, use the prepayment and cancellation guide to organize questions about written terms. The CoreAge Rx review and Ro review can be starting points for checking provider documentation. These links do not establish that either provider delivers the treatment studied here or reproduces any trial outcome.
Keeping the records separate also clarifies what an unanswered question means. Missing contractual information is not a scientific finding, while a clinical percentage is not a refund rule. Resolve each uncertainty with evidence from the record capable of answering it.
| Proposed inference | Additional record needed | Question still open |
|---|---|---|
| An event required a service | Documented assessment and service use | Was any service used, and why? |
| A service created a charge | Applicable payment documentation | What charge, if any, applied? |
| A change in care produced a refund | Written terms and an actual account record | Was a refund available and issued? |
Sources: Wharton et al.
Use safety information for its intended purpose
Wegovy is contraindicated with personal or family medullary thyroid carcinoma, MEN2, or prior serious hypersensitivity to semaglutide or its ingredients. Its boxed warning concerns rodent thyroid tumors; human relevance is unknown. Warnings include pancreatitis, gallbladder disease, dehydration-related kidney injury and severe gastrointestinal reactions. It is not recommended with severe gastroparesis. Seek prompt assessment for severe or persistent abdominal pain; contact a clinician for severe or persistent gastrointestinal symptoms. Tell the care team about treatment before anesthesia. Study timelines cannot set personal treatment changes.
This prescribing-information summary serves a different purpose from interpreting a figure. The statistical discussion does not replace the clinical assessment described above. A reader should not turn the observation rule used for an analysis into a threshold for seeking help, a schedule for managing symptoms, or instructions for changing treatment.
Likewise, a financial commitment cannot decide whether an individual should continue a medicine. The appropriate sequence is to address the clinical question with the treating professional and address payment terms through the relevant documentation. Neither a group proportion nor a prepaid amount can settle both questions. Keeping those decisions distinct is an application of careful evidence reading, rather than a conclusion about any person's treatment.
Sources: Wegovy label
Questions about the evidence
Why inspect a denominator if the percentage is already shown?
The percentage compresses a fraction; the denominator helps explain its frame. Ask who could contribute an observation and under what rule. A proportion can be arithmetically correct yet answer a different question from the one a reader has in mind. Membership deserves the same attention as the resulting number.
Sources: Wharton et al.
Can the observation window be relabeled as time since starting care?
Only if the relevant starting points actually match. A time label is part of the question, not a cosmetic description. When the origins differ, translating between them requires additional observations. Keep the named window attached to the result until that connection has been established.
Sources: Wharton et al.
Does a count of people describe how many episodes occurred?
Those are different counting units. To answer an episode question, a record must distinguish separate occurrences and define when one ends and another begins. A yes-or-no entry can be useful for its own purpose while being insufficient for that more detailed description.
Sources: Wharton et al.
Why not use a simple monthly estimate for planning?
Simplicity does not identify the event process. A monthly estimate needs a defined population at risk, a time origin, and information about occurrence through time. A division alone supplies none of those elements. Presenting its result as observed evidence would hide the assumptions doing the work.
Sources: Wharton et al.
What would make a result more applicable to my question?
Start by specifying the population, treatment alternative, outcome, and time period you mean. Then compare those definitions with the evidence. Where they differ, identify the additional information needed rather than assigning an informal similarity score. Personal care questions also require assessment beyond what this methodological exercise can provide.
Sources: Wharton et al.
Editorial assessment
Our editorial assessment is that disciplined interpretation starts before a percentage is used in a decision. Name the measured unit, preserve its denominator and observation rule, and state the comparison in words. Then identify each additional step between that result and the question you want answered. This process makes research more useful by keeping its contribution specific. For budgeting, the crucial distinction is between evidence about an observed outcome and evidence about a financial obligation. Combining them responsibly requires documented connections; it cannot be accomplished by multiplying a clinical percentage by a price.
Sources and access
- Wharton (2022): semaglutide tolerability
Article and supplement checked.
Checked .
- Rubino (2025): tirzepatide tolerability
Article and supplement checked.
Checked .
- DailyMed: Wegovy prescribing information
Current official label checked.
Checked .
- DailyMed: Zepbound prescribing information
Current official label checked.
Checked .