Comparing treatment costs invites a difficult question: how much extra care should a person plan for? A research percentage can look like the missing ingredient. Multiply it by a charge, add the result to a monthly fee, and the calculation appears complete. Yet the multiplication can conceal a much larger problem: the scientific outcome and the thing being priced may be different measurements.
This analysis uses the figure as a starting point for examining that gap. The aim is to understand what an event indicator preserves, what its denominator means, and what additional observations would be needed to study service use. The discussion below is methodological interpretation. It does not estimate anyone’s expenses or turn a treatment comparison into a recommendation about a particular care plan.
Wide tables can scroll horizontally. Keyboard users can focus a table region and use the arrow keys to move across it.
Reading the evidence
- Define the outcome
- A useful interpretation starts with the rule that turns an observation into a counted outcome.
Sources: Rubino et al.
- Keep the denominator
- A numerator gains meaning from the group to which it belongs.
Sources: Rubino et al.
- Separate occurrence from burden
- Knowing whether something happened does not reconstruct everything that followed.
Sources: Rubino et al.
- Name the observation boundary
- The question answered depends partly on when information is eligible to enter the analysis.
Sources: Rubino et al.
- Identify the missing connection
- A clinical event, a service and a payment require distinct definitions.
Sources: Rubino et al.
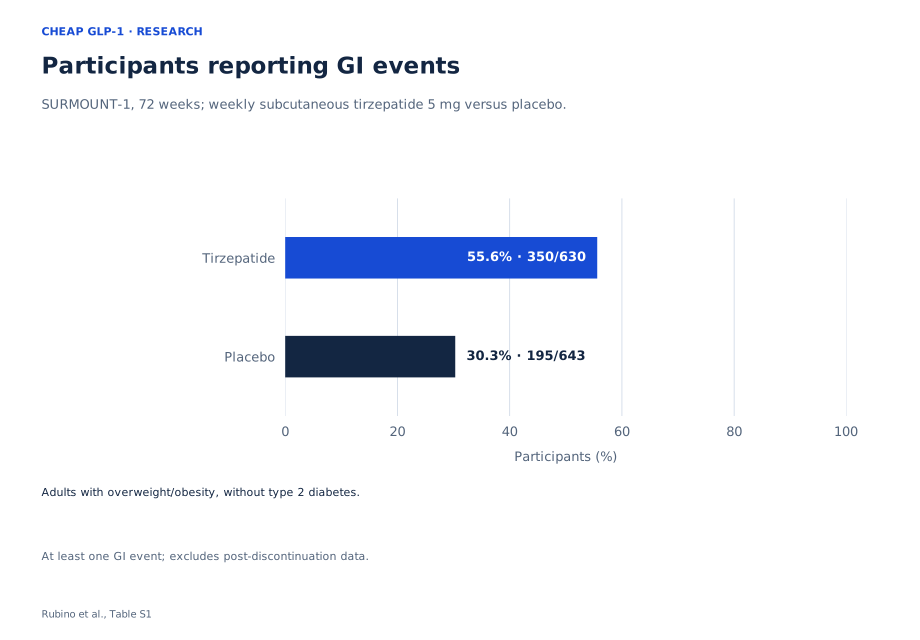
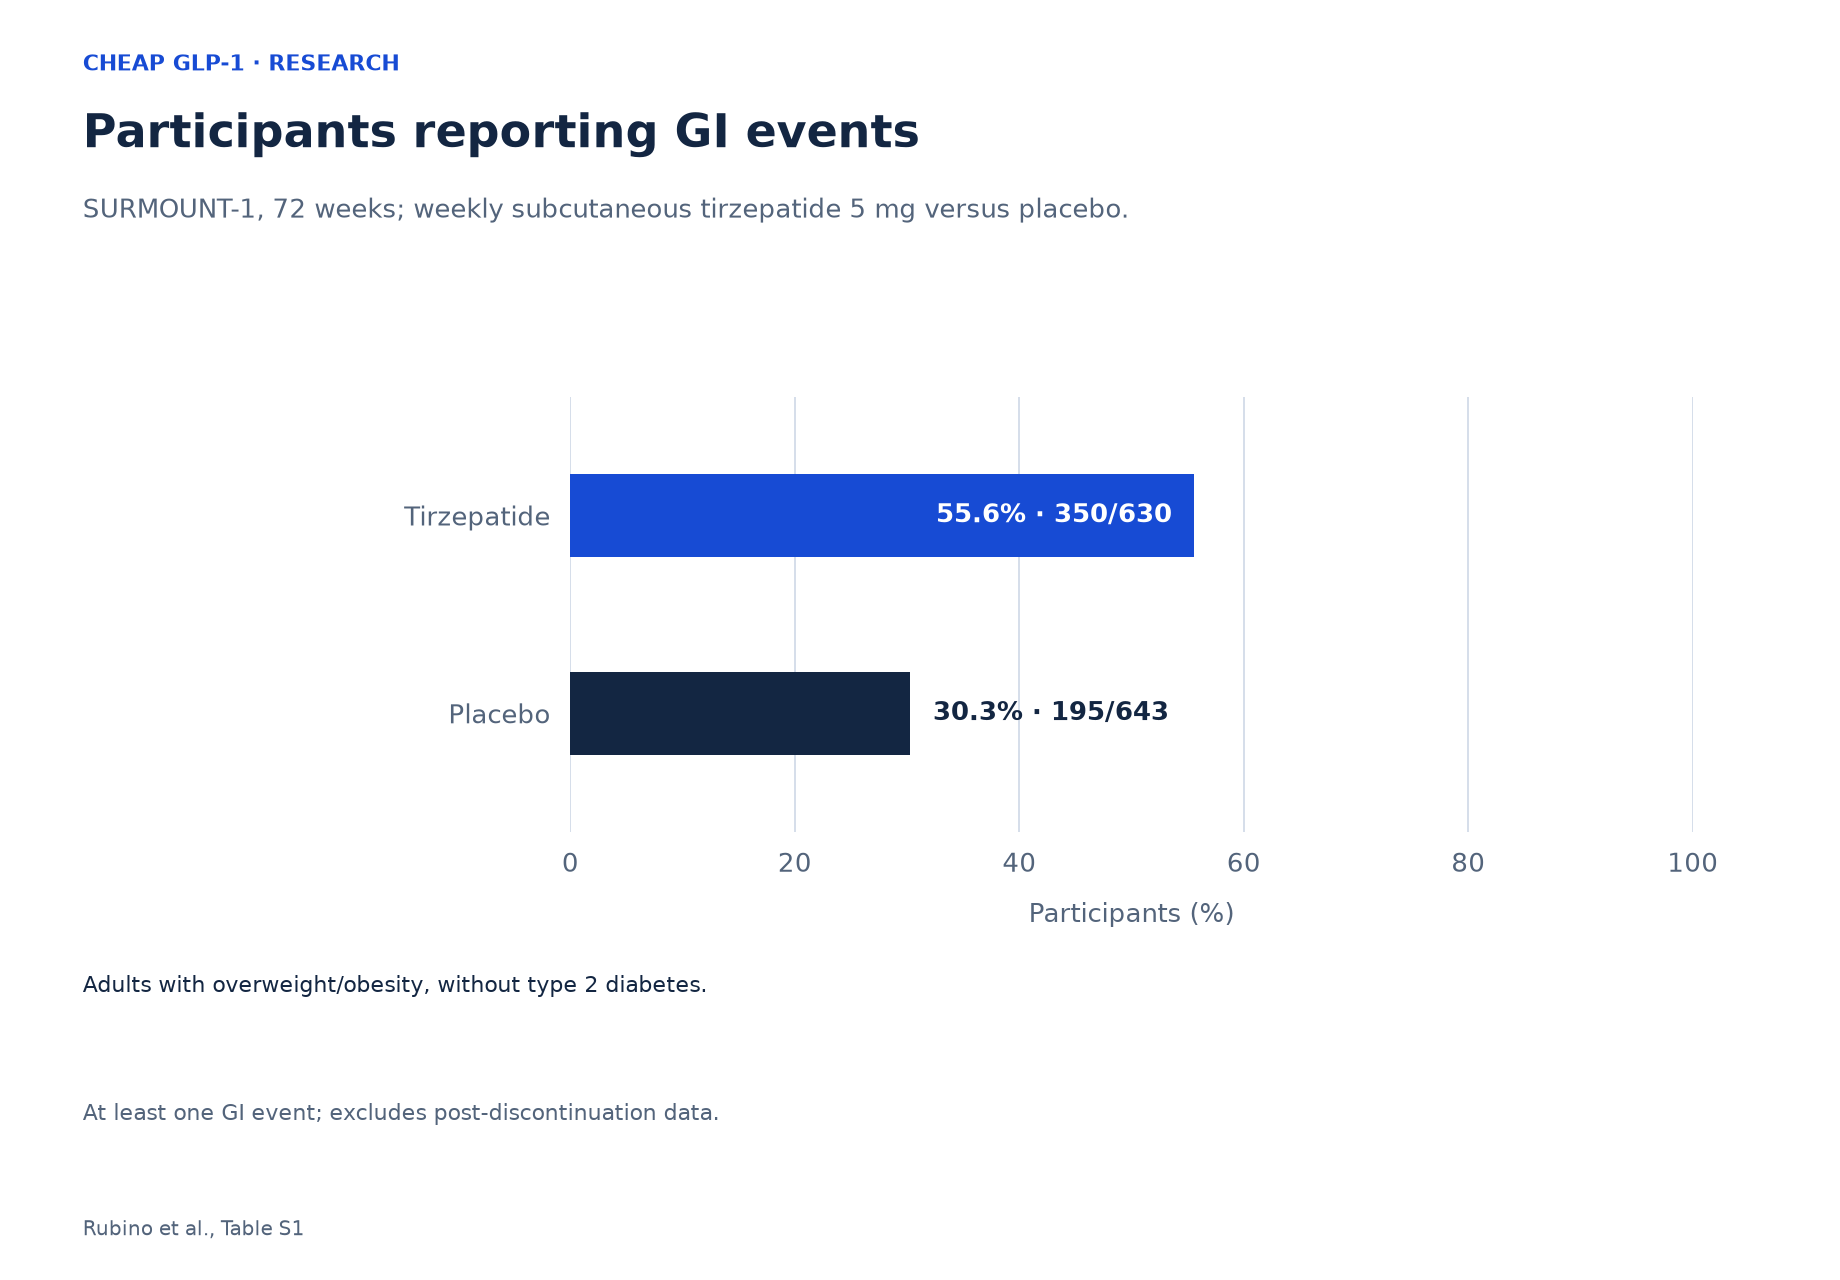
Participants reporting GI events
SURMOUNT-1, 72 weeks; weekly subcutaneous tirzepatide 5 mg versus placebo.
Adults with overweight/obesity, without type 2 diabetes.
At least one GI event; excludes post-discontinuation data.
Sources: Rubino et al.
| Arm | n/N | Percent |
|---|---|---|
| Tirzepatide | 350/630 | 55.6% |
| Placebo | 195/643 | 30.3% |
Begin with the question represented by the bars
Read a research graph as a compact answer to a specific question. Before comparing bar lengths, identify the outcome, the people eligible to contribute, and the observation boundary in its caption. These features are part of the measurement. Removing them would leave the numbers visible while changing what those numbers mean. The horizontal axis expresses a proportion; the vertical labels distinguish the groups being described.
Rubino’s post hoc analysis was funded by Eli Lilly and Company; six authors reported employment and shareholdings there.
The funding statement belongs beside an appraisal of the methods. A financial relationship is a reason to examine definitions, exclusions and interpretive choices carefully; it is not a mathematical instruction to accept or reject every result. A reproducible critique identifies which choice could change the answer and what evidence would resolve that concern. This is more informative than treating a disclosure as a substitute for reading the analysis.
For the same reason, start with the plotted question rather than a preferred shopping conclusion. An outcome can be relevant to a conversation about treatment while still being insufficient for a budget calculation. Relevance and sufficiency are different standards: the first asks whether evidence matters; the second asks whether it supports the particular inference being made.
Sources: Rubino et al.
A fraction needs its own frame of reference
A proportion relates a counted subset to a defined group. The upper part of the fraction identifies what met the counting rule; the lower part identifies the people whose experience could contribute. Both are necessary. A larger headcount can arise in a larger group without implying a larger proportion. Conversely, comparing percentages while hiding their denominators makes it harder to judge how much information supports each estimate.
When reading the displayed table, keep each numerator attached to its own denominator. Do not combine columns merely because they sit next to each other. Pooling would create a new question and would require a justification for treating the observations as members of one analysis. It would also require decisions about weighting and about which differences between groups matter. A neat combined number is not automatically a more useful one.
The denominator is also a boundary around interpretation. Ask who would have been allowed to enter it and who would remain outside. That question concerns how a finding might apply elsewhere; it is different from asking whether the arithmetic within the displayed group is correct. Sound arithmetic cannot, by itself, establish that a different population would produce the same proportion.
Sources: Rubino et al.
Occurrence is a compressed description of experience
An occurrence indicator reduces a history to a decision about whether an event definition was met. That compression makes group summaries possible, but it also discards information. A yes-or-no record cannot independently describe how often an experience recurred, how long it lasted, how disruptive it was, or what happened afterward. These are separate outcomes that would need their own collection rules.
Consider an explicitly fictional, nonclinical example. Two equipment services report the same share of machines with a fault. In one service, each affected machine needs a single repair. In the other, some machines return repeatedly. The initial fault proportions can match even though the repair workloads differ. This example illustrates lost information; it supplies no estimate of healthcare use or any treatment outcome.
The scientific lesson is to match the level of the claim to the level of the record. Person-level occurrence, repeated episodes and accumulated burden are related concepts, but they are not interchangeable units. A calculation that changes units must explain the connecting evidence. Otherwise, it silently fills the missing history with an assumption. When a headline sounds more detailed than the underlying outcome, inspect whether that additional detail was actually measured.
Sources: Rubino et al.
Treatment assignment and later experiences create different groups
Random allocation and grouping people by something that happens later are different analytical operations. Random allocation is designed to make assigned groups comparable before their subsequent experiences unfold. A group defined afterward by an experience can reflect multiple influences, including characteristics that were not part of the allocation rule. These distinctions matter when someone moves between a treatment comparison and a symptom-based comparison.
Imagine asking whether people who experience an event also have a different outcome. That is a question about an association within observed histories. It does not automatically become a randomized test of the event itself. The event may share causes with the later outcome, or the ability to observe both may depend on continued participation. Establishing a causal pathway would require more than relabeling the groups in a treatment graph.
Keep the comparison identified in the figure attached to the claim it supports. If a new question requires reorganizing people by later experience, identify that as a new analysis with its own assumptions. Our semaglutide evidence reading develops another way of examining observation and selection. Reading the two explanations together is a methods exercise, not a comparison of treatment performance.
Sources: Rubino et al.
The edge of the observation window matters
An analysis needs a rule for deciding which observations belong. That rule may depend on calendar time, treatment exposure, follow-up status, or another condition. The caption’s boundary tells the reader where to look for that rule. A result can answer its defined question coherently while leaving a broader question unresolved. The absence of information outside a boundary should not be translated into evidence that nothing happened there.
For example, a question about experiences during a defined period differs from a question about everything that happens after a person first considers treatment. Extending the second question requires additional observations, rather than a new label on the first answer. It also requires a plan for dealing with incomplete records. Assuming that unobserved experiences resemble observed ones is an analytical choice that needs a reason.
Do not guess why records are absent or assume that any resulting distortion must point in one direction. Those judgments require evidence about the missingness process. In an editorial application to budgeting, the six-month planning guide can help organize a financial time frame. A chosen payment horizon does not redefine the scientific observation window or create the missing follow-up information.
Sources: Rubino et al.
Precision, variation and individual prediction are separate questions
A displayed estimate is a summary, not an exact description of every possible repetition of the research process. Sampling variation concerns how a result might differ if a comparable study were repeated. Measurement choices concern how observations become records. Differences between populations concern whether the same question would have a similar answer elsewhere. These sources of uncertainty should not be bundled into a single vague statement that a result is uncertain.
Likewise, a difference in bar lengths does not, on its own, provide a complete account of uncertainty. A reader should not draw confidence limits by eye, reverse engineer a significance claim from rounded percentages, or assume that an omitted interval has zero width. A formal comparison needs a specified method and an explanation of what that method accounts for. Additional calculations can introduce assumptions rather than reveal hidden facts.
Individual prediction adds another task. A group estimate does not identify which person will have which experience. A defensible prediction would require relevant individual information, a suitable model and evidence about its performance. Recognizing this distinction does not make group evidence useless. It clarifies its role as a contribution to understanding a defined comparison, rather than a personalized forecast extracted from a chart.
Sources: Rubino et al.
Map the steps between an endpoint and a bill
A financial inference needs a chain of measurements. An event may be followed by an assessment, an assessment may lead to a management choice, and a service may or may not generate a particular payment. Each connection requires evidence about what happens and how it is recorded. The scientific problem is not solved by assuming that every link is identical for everyone.
The teaching table separates these steps so that an appealing shortcut becomes visible. It is an original framework for evaluating a proposed calculation, not a report of observed care patterns. A serious analysis would define the perspective as well: a patient’s payment, a provider’s resource use and a payer’s expense are different quantities. Combining them without stating whose costs count can produce a total that answers no clear question.
Our editorial application is to keep a blank space where the connecting evidence is missing. A blank space is more honest than assigning an invented charge to a research event. The total-cost checklist addresses documentary charges. Use it to organize financial terms, while allowing the research to retain its own outcome definitions and limits.
| Connection | Evidence needed | Shortcut to avoid |
|---|---|---|
| Recorded outcome to assessment | Linked observations with a defined assessment rule | Treating every recorded outcome as an appointment |
| Assessment to service use | Documentation of the services that actually followed | Assigning an identical service to every assessment |
| Service use to payment | Applicable charges, coverage and payment perspective | Treating a service count as an amount paid |
Sources: Rubino et al.
Benefit and expense require their own outcomes
Evaluating overall value means deciding which outcomes matter and how they relate to the resources being considered. A symptom measure cannot stand in for every benefit, every harm, or every expense. Before using evidence in a value judgment, specify the decision. Is the question about clinical outcomes, affordability, service availability, or the financial consequences of a particular arrangement? Different questions require different observations.
A formal economic comparison would also need a coherent time horizon and a way to connect relevant outcomes across that horizon. It should explain the alternatives being compared and identify whose resources are counted. Without those choices, dividing an advertised price by a research percentage is merely arithmetic with mismatched quantities. It does not become a meaningful value measure because both inputs are expressed numerically.
The table offers an original separation of decision types. It does not rank treatments or payment arrangements. In a practical application, the insurance and cash-pay guide is a place to organize questions about different financial pathways. Evidence appropriate to one pathway must still be checked for the particular comparison a reader wants to make.
| Decision question | Relevant evidence | Insufficient substitute |
|---|---|---|
| What clinical tradeoff matters? | Clearly defined benefit and harm outcomes | A single outcome treated as the whole picture |
| What resources are involved? | Measured service use with a stated perspective | An occurrence indicator treated as workload |
| What would the individual pay? | Applicable written financial terms | A research comparison treated as a personal quote |
Sources: Rubino et al.
Use commercial documents for the questions they can answer
The methodological distinction becomes useful when reading a care-plan description. Treat a service statement as a proposition to verify in written terms. Identify what would make it true, what time period it concerns, and whether the wording distinguishes a recurring charge from an optional or conditional item. This is an editorial approach to evaluating documents, not a claim about the current terms of any company.
A source trail should follow the claim. Scientific evidence belongs beside scientific statements; contractual evidence belongs beside contractual statements. A link to research does not establish a business’s policies, and a provider’s explanation does not change a study’s population or outcome definition. The online-provider checklist can help a reader organize the separate documentary questions before discussing an arrangement.
For examples of the questions to bring to a review, open our Mochi Health review or Hers review. These links invite checking the underlying terms and their dates. They do not establish that either service supplies the studied intervention or reproduces research outcomes. The analytical task remains to connect each conclusion to evidence capable of supporting that particular conclusion.
Sources: Rubino et al.
Keep the clinical decision distinct from the payment decision
Zepbound is contraindicated with personal or family medullary thyroid carcinoma, MEN2, or serious hypersensitivity to tirzepatide or its ingredients. Its boxed warning concerns rodent thyroid tumors; human relevance is unknown. Warnings include pancreatitis, gallbladder disease, dehydration-related kidney injury and severe gastrointestinal reactions. It is not recommended with severe gastroparesis. Seek prompt assessment for severe or persistent abdominal pain; contact a clinician for severe or persistent gastrointestinal symptoms. Tell the care team about treatment before anesthesia. Research categories cannot determine personal treatment changes.
The methodological point is that a research category, a prescribing warning and a financial commitment serve different purposes. A study classification helps define an analysis. Clinical information helps frame an individual conversation with a qualified professional. A payment document establishes financial terms. No one of these documents can perform all of those functions simply because they concern the same treatment decision.
A budget discussion should therefore leave room for the clinical question to be answered on its own terms. Affordability does not supply missing medical information, and a medical assessment does not by itself explain a contract. Keeping the questions distinct makes it possible to ask the right person for the right evidence, without interpreting a percentage as an instruction about personal care.
Sources: Zepbound label
Questions about the evidence
Does an event percentage describe how demanding an experience will be?
No. The measurement needed to describe burden depends on what burden means in the question: duration, recurrence, disruption or another outcome. An occurrence indicator cannot reconstruct all of those dimensions. First define the additional outcome, then look for evidence that measures it. Do not create a detailed history from a summary that was designed to answer a narrower question.
Sources: Rubino et al.
Why retain the denominators when percentages are easier to compare?
The denominators show the groups from which the proportions were formed. Keeping them visible helps distinguish a difference in headcounts from a difference in proportions and makes the information supporting each estimate easier to inspect. It also discourages casual pooling. A combined figure needs a scientific rationale, rather than being assumed useful because it is simpler.
Sources: Rubino et al.
Can a research observation window be converted into a monthly forecast?
A different time scale requires information about timing and who remains observable across that time scale. Dividing a whole-period summary into equal calendar pieces does not supply those observations. If a model assumes a particular pattern, the assumption should be stated and tested where possible. It should not be presented as a feature recovered directly from the graph.
Sources: Rubino et al.
What would connect a symptom measure to a service estimate?
The connection would require observations that link the defined outcome to subsequent assessments and services, with clear rules for repeated use and missing records. An estimate of payment would need another layer of applicable financial information. These are requirements for a proposed analysis, not evidence that a particular pattern of care actually follows the outcome in the figure.
Sources: Rubino et al.
How should financial planning fit into an individual treatment conversation?
Treat the financial and clinical questions as related parts of a decision that need different evidence. Bring written terms to the financial discussion and relevant medical information to the clinician. Neither an affordable quote nor a population summary completes an individual assessment. A clear plan identifies which questions remain unanswered and which source or professional is positioned to address them.
Sources: Zepbound label
Editorial assessment
The strongest reading of an event graph preserves the question that produced it. Follow the outcome definition, keep each fraction intact, inspect the observation boundary and distinguish group description from personal prediction. Then identify the evidence missing from any proposed extension. Our editorial judgment is that a cost comparison becomes more useful when these gaps stay visible. Research can sharpen the questions a reader asks without supplying a service forecast, a contract interpretation or an individualized treatment decision. A transparent comparison shows where each conclusion comes from and where further information is still needed.
Sources and access
- Wharton (2022): semaglutide tolerability
Article and supplement checked.
Checked .
- Rubino (2025): tirzepatide tolerability
Article and supplement checked.
Checked .
- DailyMed: Wegovy prescribing information
Current official label checked.
Checked .
- DailyMed: Zepbound prescribing information
Current official label checked.
Checked .